
Introduction
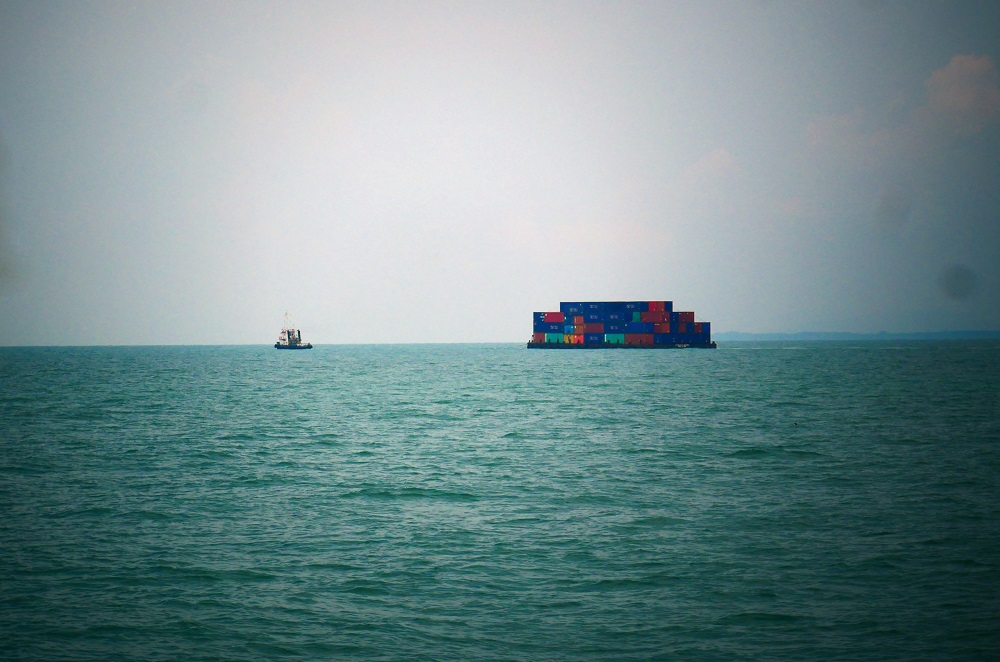
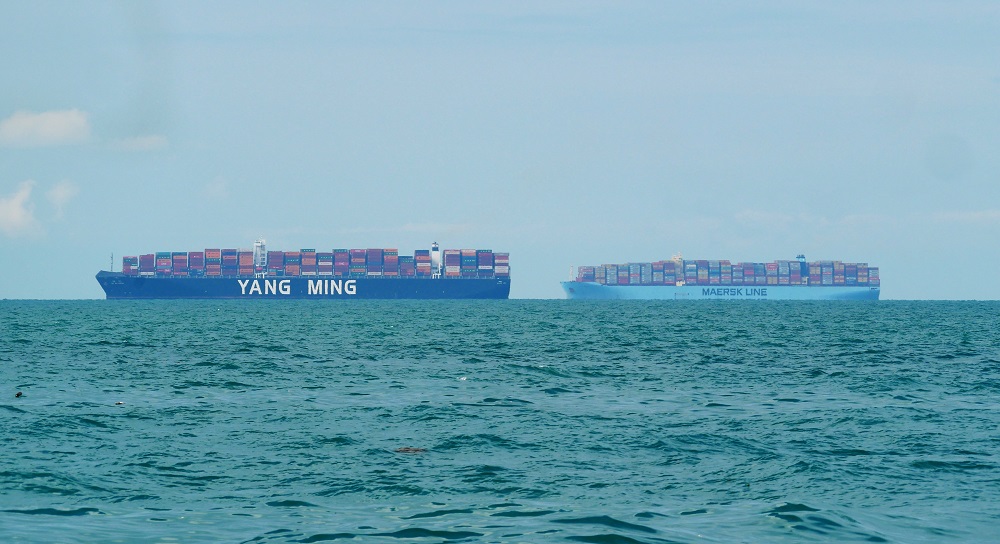
Singapore Strait is one of the busiest shipping lanes in the world, and some of the biggest ships in the world use it! It is 105 km long and 16 km wide and around 2000 merchant ships go through it every day. A quarter of the worlds traded goods go through the Singapore Strait. The largest container ships in the world are about 400 m long and many of these go through the area.
Our AIS (Automatic Identification System) logs all the ships we meet in a 20-mile radius. We wanted to find out if:
- Cargo ships are bigger than tankers
- Longer ships are wider
- Wider ships have deeper draughts
- Smaller vessels travel faster
- Cargo ships travel faster than tankers
- There are more cargo ships than tankers.
Method
On 12 and 13 October 2019, we logged details from ships we met in the Singapore Strait for a period of 18 hours as we were sailing along. The things we logged were:
- MMSI number (maritime mobile service identity – the ship’s unique identifier code)
- Name
- Length
- Width
- Draught
- Speed
- Position
- Port of destination
- Time
- Type
- Status, underway or at anchor
- Latitude
- Longitude
- COG (course over ground)
We entered the data into an Excel spreadsheet where we analysed it for our boat school maths.
Results and discussion
We logged 132 ships in total, of which 18 were too far away to get the type (the AIS records more details as the ships come closer). 36 ships were heading to Singapore, and 18 to China. 16 were heading to places in Malaysia, some to Japan and some to Indonesia, as well as Australia, Taiwan, Thailand, Vietnam and Brunei.
The pie chart below shows the number of each type of vessel.

Overall, we saw more tankers than any other ships, although cargo ships came close. All the other types of ships were very scarce. This makes sense because Singapore Port is the busiest cargo port in the world and almost a third of the ships were going there, and some of the other ships might have come from there.
The next graph shows the length versus the width of the ships.
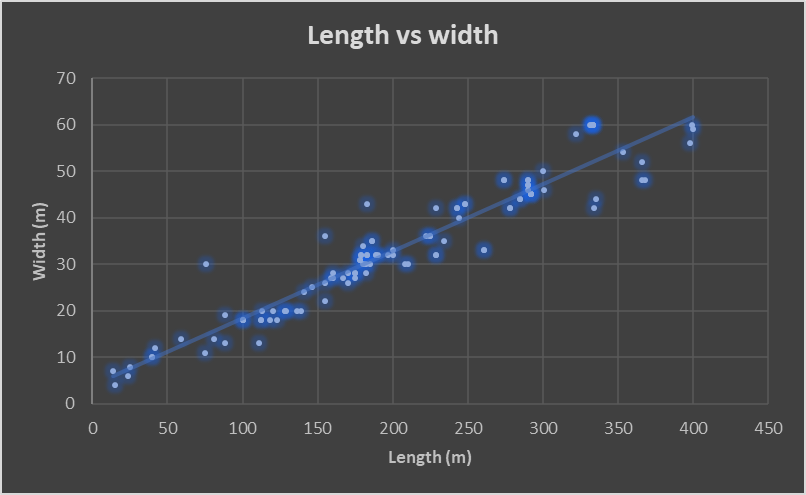
The ships increase in width as they increase in length. According to our data, the width of a ship is about 19 per cent of the length, although it does vary.
The graph below shows the relationships between the draught and the width.

We assumed that the wider the ship is the deeper the draught. Our data showed that it was generally true, but it varied quite a bit.
The longer the ship, the wider it is. The draught has to be bigger on the bigger ships otherwise the ship will not be weighed down.
The next graph shows speed versus length.
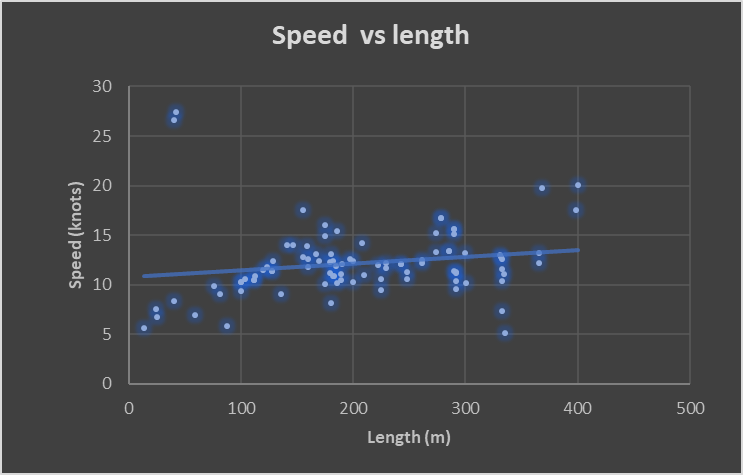
One of our hypotheses was that smaller vessels travelled faster than larger vessels. This was proven to be false. The two fastest ships were small, about 40 metres long, and were ferries.
We wanted to see if there was a difference in the speed of cargo ships and tankers. The next graph shows this.
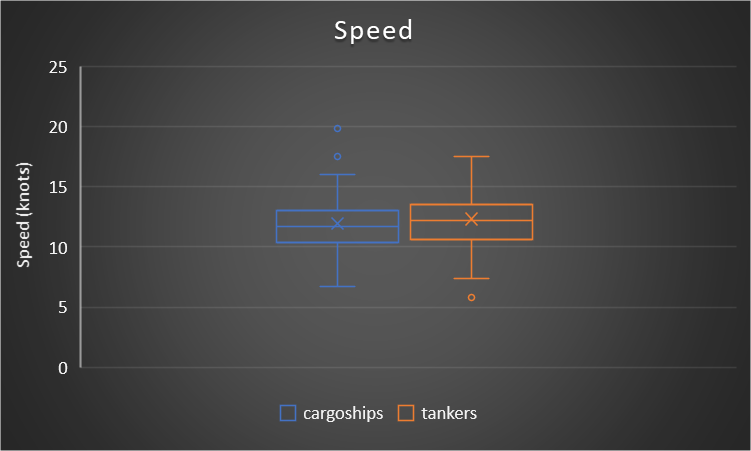
We thought that cargo ships travel faster than tankers, and we were right: the maximum speed of cargo ships was higher than tankers, but the tankers’ median speed was higher.
Below is a box plot showing the length of different types of ships.

Our last assumption was that cargo ships were bigger than tankers. This one varied a lot, but cargo ships beat tankers by more than 50 m, in terms of their maximum. The largest ship was 400 metres, so it was one of the largest ships in the world! The smallest cargo ship was much smaller than the smallest tanker, and the range of sizes in cargo ships was much larger than tankers.
Nowadays ships are reaching their maximum size. Too much bigger than 400 metres and the ship will not fit under any bridges, not fit through any canals, be very restricted to move, and will not be able to go in places much shallower than 20 metres. For example, a ship over 320 metres long cannot go through the Panama Canal, and a ship deeper than twenty metres cannot go through the Suez Canal.
Conclusion
We saw a lot of ships but if we continued plotting, we would have found many more. Most were recorded during the night. To make it more fun we pretended we were blowing them up so we needed all their statistics to find the right bomb.

